empty
12.05.2025 03:48 AM
Trading Recommendations and Analysis for EUR/USD on May 12. The Euro Is in No Hurry to Fall, and the Dollar to Rise

EUR/USD 5-Minute Analysis

This image is no longer relevant

The EUR/USD currency pair could not continue its downward movement on Friday. This is not surprising, as any dollar growth is achieved with significant effort. Regardless of the macroeconomic or fundamental background, if the market refuses to buy the dollar, it will not rise under any circumstances. Thus, on Thursday, we saw a rise in the U.S. currency, and the price broke out of the three-week sideways channel. But all good things come to an end. At this point, the price has corrected to the critical line, so a renewed decline appears logical from a technical perspective. However, it's worth noting that traders still do not favor the dollar.

There were no fundamental or macroeconomic events on Friday. Therefore, it is clear that the recent weakness of the dollar was not caused by any news. As a result, we observe the following pattern: when the dollar has all the reasons to rise, it does so slowly and with difficulty. When there are no reasons for growth, it falls or trades sideways. We doubt the market's ability to continue its downward momentum.

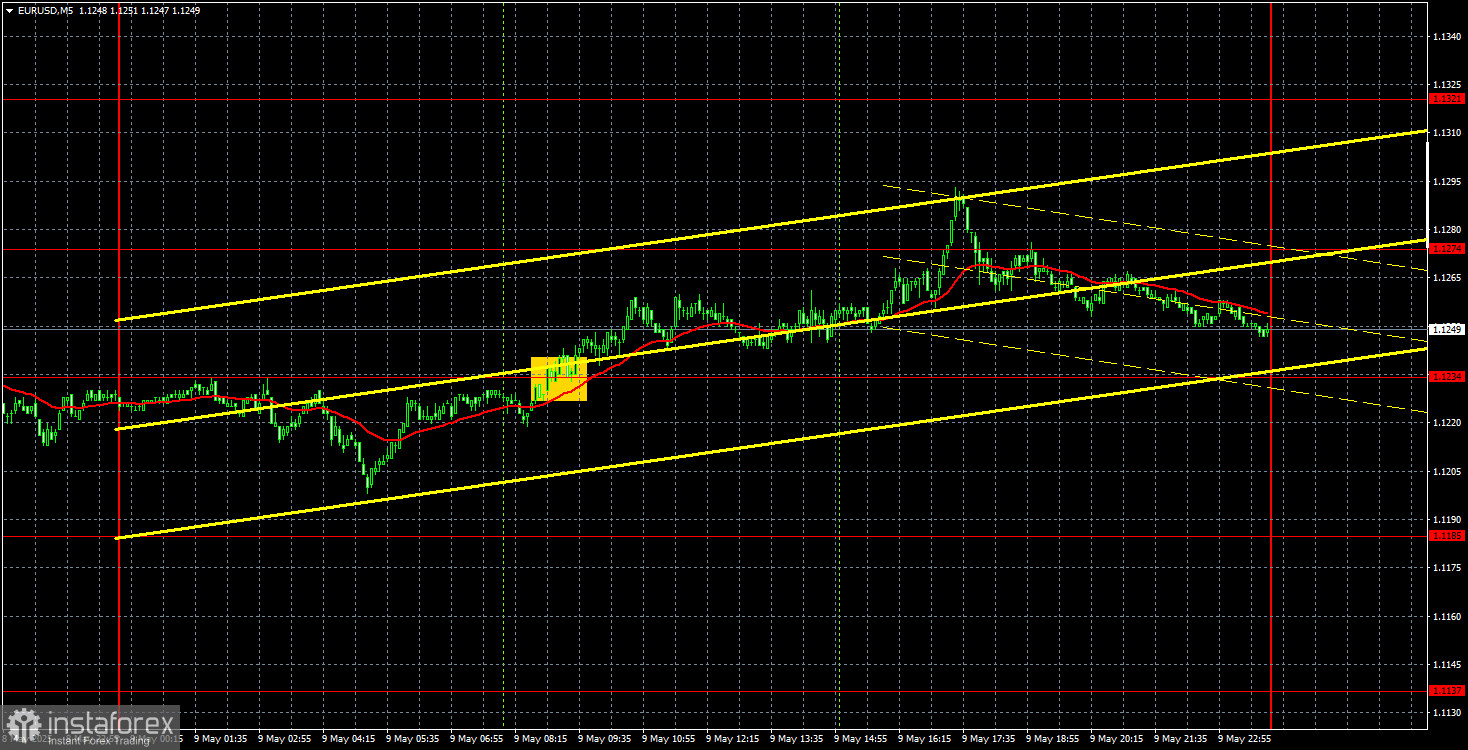
In the 5-minute timeframe, one trade signal worth mentioning was formed. During the European session, the price consolidated above the 1.1234 level, leading to a rise above 1.1274. However, this growth did not last long, so after consolidating below that level, it made sense to exit long positions. Opening new short positions before the market closed for the weekend was likely not the most reasonable decision.

COT Report

This image is no longer relevant

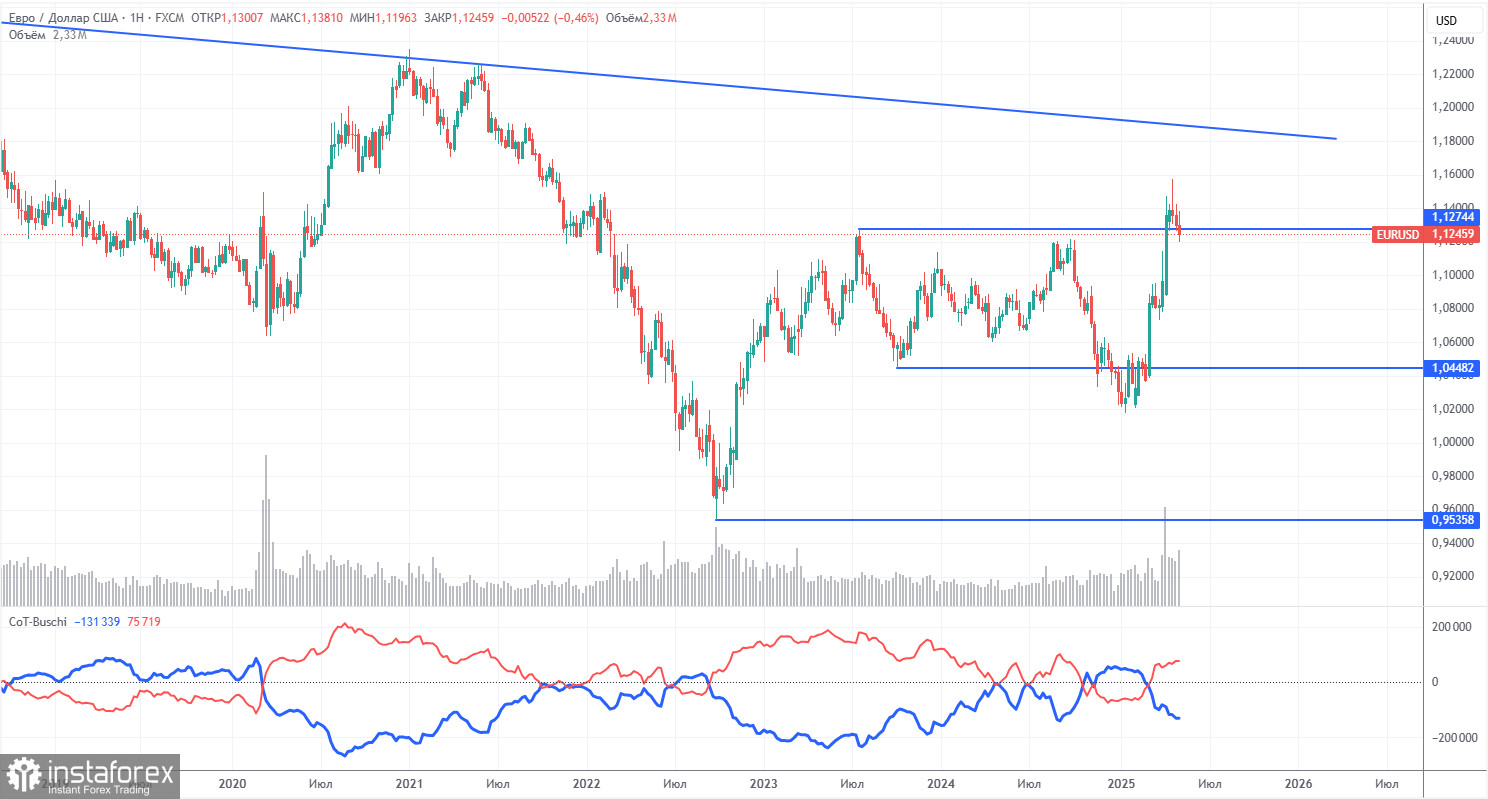
The latest COT (Commitment of Traders) report is dated May 6. As shown in the chart above, the net position of non-commercial traders remained bullish for a long time. Bears briefly took the lead but quickly lost it. Since Trump took office, the dollar has been in free fall. We can't say with certainty that the dollar's decline will continue, and the COT reports reflect the actual sentiment of large players, which can change rapidly under current circumstances.

We still see no fundamental factors for the euro to strengthen, but one major factor remains for the dollar to fall. The pair may continue to correct for several more weeks or months, but a 16-year downtrend will not reverse quickly. Once Trump concludes his trade wars, the dollar may return to growth.

The red and blue lines have crossed again, indicating a return to a bullish trend. Over the last reporting week, the number of longs among the "non-commercial" group decreased by 2,200, and the number of shorts decreased by 2,100. Accordingly, the net position remained virtually unchanged for the week.

EUR/USD 1-Hour Analysis

This image is no longer relevant

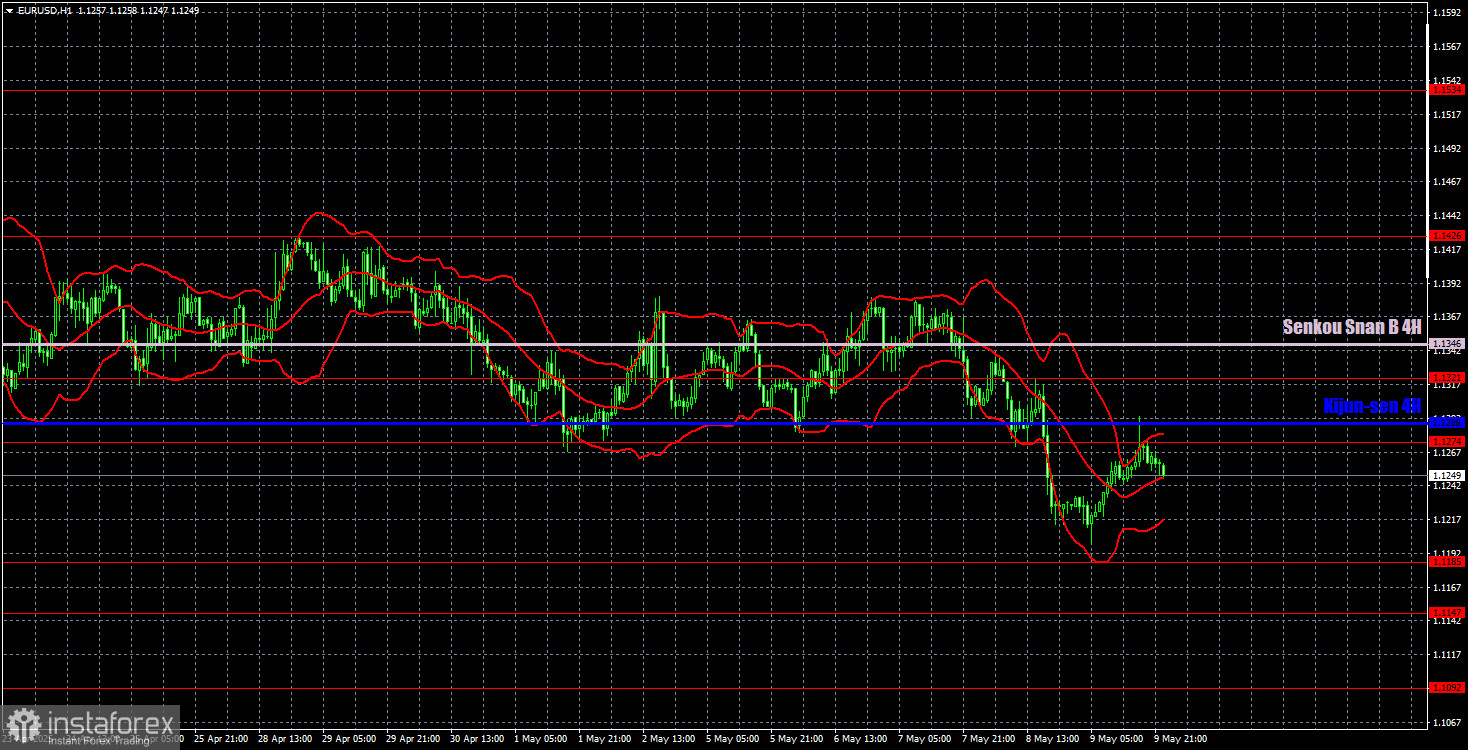
In the hourly timeframe, EUR/USD broke out of the sideways channel, but this does not necessarily mean the downward movement will last another week. There is still little logic or technical clarity in price movements across timeframes. It seems the market is tired of waiting for Trump's new tariffs and has decided to start taking profits in long positions. The Federal Reserve's position on monetary policy may also have played a role. However, we cannot yet say that the "dollar nightmare" is over.

Key trading levels for May 12: 1.0823, 1.0886, 1.0949, 1.1006, 1.1092, 1.1147, 1.1185, 1.1274, 1.1321, 1.1426, 1.1534, 1.1607, 1.1666. Ichimoku indicator lines: Senkou Span B (1.1346), Kijun-sen (1.1288). These lines may move throughout the day and should be considered when identifying trade signals. Don't forget to move your Stop Loss to breakeven if the price moves 15 pips in the correct direction—this protects against potential losses in case of a false signal.

No significant events are scheduled in either the Eurozone or the U.S. on Monday, so we don't expect strong movements during the day. Trading will rely entirely on technical analysis, though EUR/USD does not always behave technically. Caution is advised when opening any positions.

Illustration Explanations:

  • Support and resistance price levels – thick red lines where movement may end. They are not trading signal sources.
  • Kijun-sen and Senkou Span B lines—These are strong Ichimoku indicator lines transferred to the hourly timeframe from the 4-hour one.
  • Extremum levels – thin red lines where the price has previously rebounded. These act as trading signal sources.
  • Yellow lines – trend lines, trend channels, and other technical patterns.
  • COT Indicator 1 on the charts – the size of the net position for each category of traders.
Paolo Greco,
Analytical expert of InstaForex
© 2007-2025
Summary
Urgency
Analytic
Stanislav Polyanskiy
Start trade
Earn on cryptocurrency rate changes with InstaForex
Download MetaTrader 4 and open your first trade
  • Grand Choice
    Contest by
    InstaForex
    InstaForex always strives to help you
    fulfill your biggest dreams.
    JOIN CONTEST

Recommended Stories

How to Trade the GBP/USD Pair on July 22? Simple Tips and Trade Analysis for Beginners

Analysis of Monday's Trades 1H Chart of GBP/USD On Monday, the GBP/USD pair exhibited movements nearly identical to those of the EUR/USD pair. This suggests that the US dollar

Paolo Greco 06:39 2025-07-22 UTC+2

How to Trade the EUR/USD Pair on July 22? Simple Tips and Trade Analysis for Beginners

Analysis of Monday's Trades 1H Chart of EUR/USD On Monday, the EUR/USD currency pair is likely to have completed a three-week downward trend. As a reminder, over the past

Paolo Greco 06:39 2025-07-22 UTC+2

Trading Recommendations and Trade Breakdown for GBP/USD on July 22: The Pound Begins to Reverse the Trend

The GBP/USD currency pair also maintained an upward trajectory throughout Monday. The reasons were identical to those for EUR/USD. The dollar had been rising for three weeks on pure trader

Paolo Greco 03:45 2025-07-22 UTC+2

Trading Recommendations and Trade Breakdown for EUR/USD on July 22: The Dollar's Fairytale Is Over

On Monday, the EUR/USD currency pair continued its upward movement, which began last week. There were no local macroeconomic reasons for the euro's rise, but there were plenty of fundamental

Paolo Greco 03:45 2025-07-22 UTC+2

GBP/USD: Trading Plan for the European Session on July 21. Commitment of Traders (COT) Reports (Analysis of Yesterday's Trades). Pound Attempted to Recover

Last Friday, only one entry point into the market was formed. Let's look at the 5-minute chart and analyze what happened. In my morning forecast, I highlighted the 1.3442 level

Miroslaw Bawulski 08:12 2025-07-21 UTC+2

EUR/USD: Trading Plan for the European Session on July 21. Commitment of Traders (COT) Reports (Analysis of Yesterday's Trades). Euro Correction Is Nearing Its End

Only one market entry point was formed last Friday. Let's look at the 5-minute chart to see what happened. In my morning forecast, I highlighted the 1.1654 level

Miroslaw Bawulski 08:11 2025-07-21 UTC+2

How to Trade the GBP/USD Pair on July 21? Simple Tips and Trade Analysis for Beginners

Analysis of Friday's Trades 1H Chart of GBP/USD The GBP/USD pair also traded higher on Friday, but this movement had little meaningful impact. The downtrend in the British pound remains

Paolo Greco 04:01 2025-07-21 UTC+2

How to Trade the EUR/USD Pair on July 21? Simple Tips and Trade Analysis for Beginners

Analysis of Friday's Trades 1H Chart of EUR/USD On Friday, the EUR/USD currency pair continued its upward movement after rebounding twice from the 1.1563 level

Paolo Greco 04:01 2025-07-21 UTC+2

How to Trade the GBP/USD Pair on July 18? Simple Tips and Trade Analysis for Beginners

Analysis of Thursday's Trades 1H Chart of GBP/USD On Thursday, the GBP/USD pair also traded with minimal volatility. Strangely enough, there was quite a lot of interesting data released yesterday

Paolo Greco 06:13 2025-07-18 UTC+2

How to Trade the EUR/USD Pair on July 18? Simple Tips and Trade Analysis for Beginners

Analysis of Thursday's Trades 1H Chart of EUR/USD On Thursday, the EUR/USD currency pair traded in a near-flat range with very low volatility (around 50 pips). After the storm

Paolo Greco 06:13 2025-07-18 UTC+2
Can't speak right now?
Ask your question in the chat.
Widget callback
 

Dear visitor,

Your IP address shows that you are currently located in the USA. If you are a resident of the United States, you are prohibited from using the services of InstaFintech Group including online trading, online transfers, deposit/withdrawal of funds, etc.

If you think you are seeing this message by mistake and your location is not the US, kindly proceed to the website. Otherwise, you must leave the website in order to comply with government restrictions.

Why does your IP address show your location as the USA?

  • - you are using a VPN provided by a hosting company based in the United States;
  • - your IP does not have proper WHOIS records;
  • - an error occurred in the WHOIS geolocation database.

Please confirm whether you are a US resident or not by clicking the relevant button below. If you choose the wrong option, being a US resident, you will not be able to open an account with InstaForex anyway.

We are sorry for any inconvenience caused by this message.