Analysis:
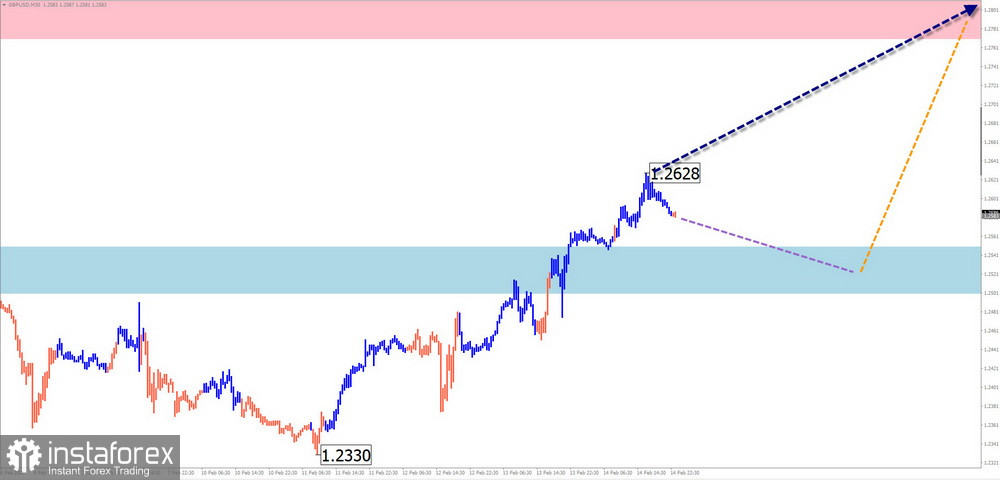
The downward wave has shaped the short-term movement of the British pound for the past six months. Since mid-January, a counter-trend bullish wave has been forming, showing strong reversal potential. Currently, the price is near the upper boundary of a major weekly reversal zone.
Forecast:
At the start of the upcoming week, sideways movement is expected, with a possible decline toward support before a reversal and price recovery. The resistance zone is located at the lower boundary of the preliminary target area.
Potential Reversal Zones:
- Resistance: 1.2770 – 1.2820
- Support: 1.2550 – 1.2500
Recommendations:
- Selling: Low potential and high risk.
- Buying: Becomes viable once confirmed reversal signals appear near support.
AUD/USD
Analysis:
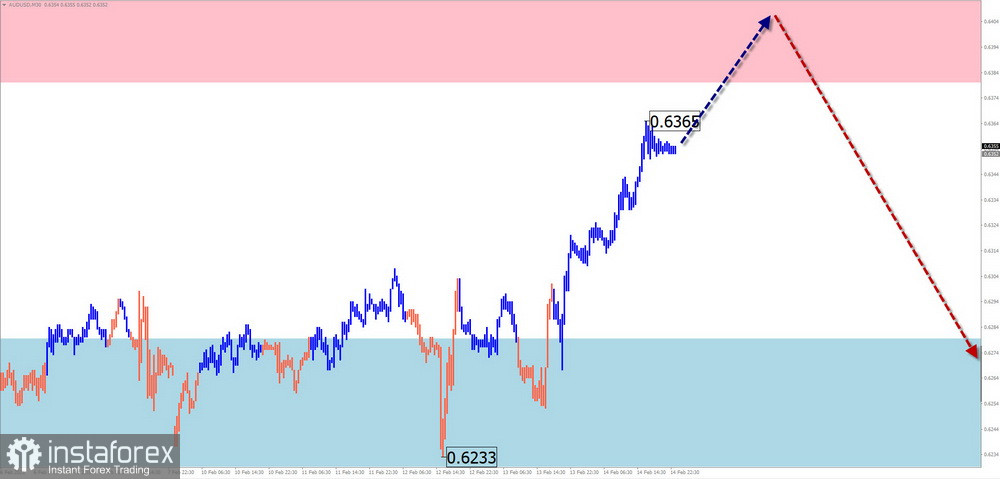
The downward wave pattern in the Australian dollar has been completed. Over the past two weeks, prices have formed a bullish reversal wave of a higher wave level. The final section (C) is currently forming, and the price has reached the lower boundary of a potential reversal zone.
Forecast:
In the coming days, the pair is likely to continue its sideways movement with a slight upward bias. A test of resistance and a brief breakout of its upper boundary is possible. However, by the weekend, a reversal and decline are more likely.
Potential Reversal Zones:
- Resistance: 0.6380 – 0.6430
- Support: 0.6260 – 0.6210
Recommendations:
- Buying: Risky due to limited potential, may lead to losses.
- Selling: Consider small-lot trades within individual sessions after confirmed reversal signals.
USD/CHF
Analysis:
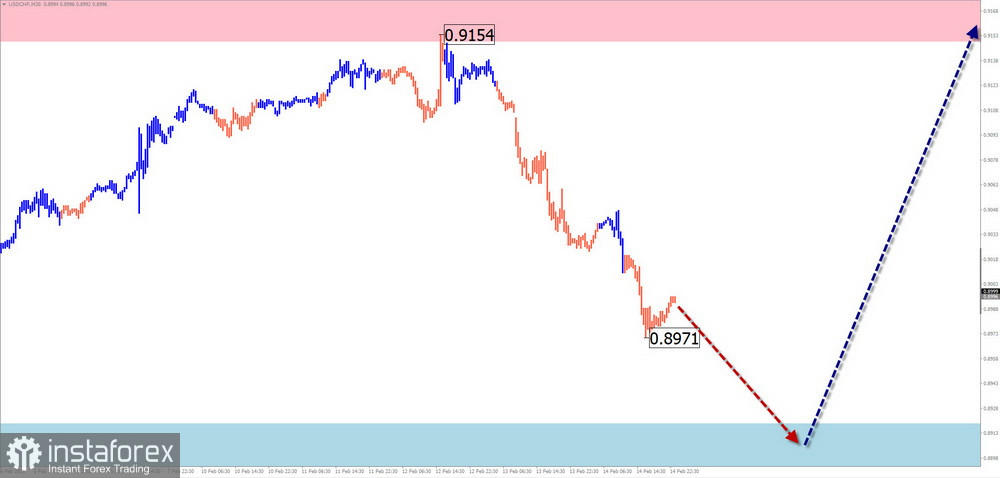
Since late December, an upward wave has defined the movement of USD/CHF. However, this wave now appears to be complete. Since early February, the pair has been in a correction phase, which is nearing its final stage.
Forecast:
Throughout the week, a sideways movement is expected. In the next few days, a bearish bias is more likely, with potential pressure on the lower support boundary. A reversal and renewed growth may occur by the end of the week.
Potential Reversal Zones:
- Resistance: 0.9150 – 0.9200
- Support: 0.8920 – 0.8870
Recommendations:
- Selling: Possible with small-lot trades during individual sessions until the first reversal signals appear.
- Buying: Not recommended until confirmed reversal signals emerge near support.
EUR/JPY
Analysis:
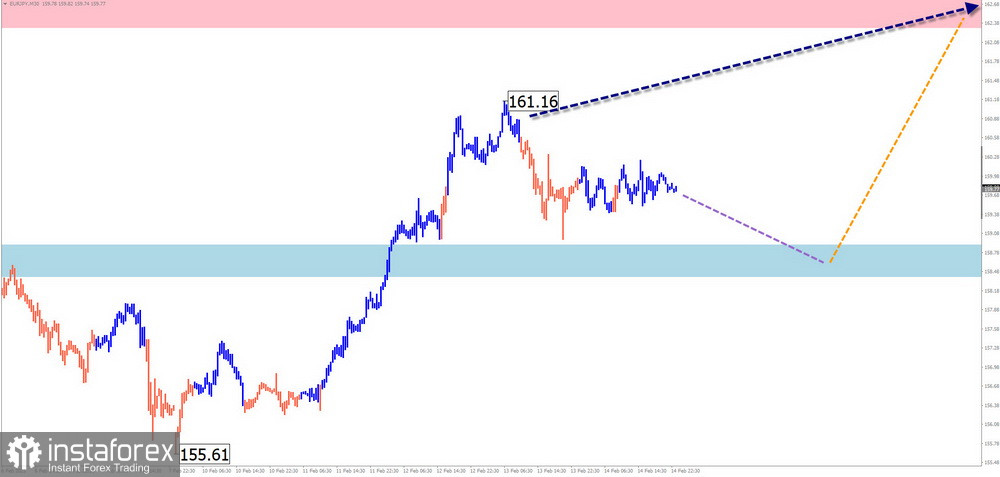
The incomplete upward wave pattern in EUR/JPY has been developing since August 5. The price extremes form a shifting horizontal plane, with one final wave section yet to be completed. The calculated resistance level is at the lower boundary of a weekly reversal zone.
Forecast:
A downward trend is expected in the coming days, followed by a sideways drift after touching the support zone. A temporary breakout below support is possible, with an increased likelihood of an upward reversal by the weekend.
Potential Reversal Zones:
- Resistance: 162.30 – 162.80
- Support: 158.90 – 158.40
Recommendations:
- Selling: Possible with small-lot intraday trades.
- Buying: Only advisable after confirmed reversal signals near support.
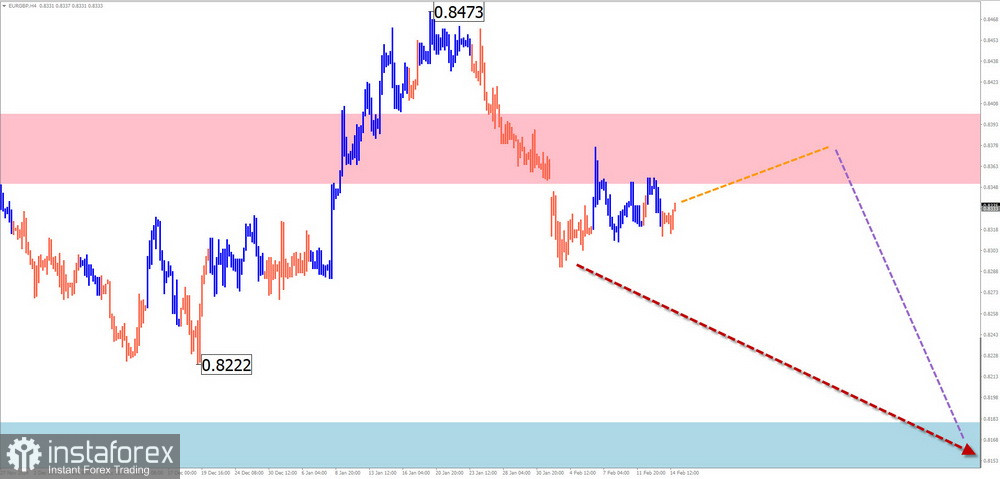
EUR/GBP
Analysis:
EUR/GBP has followed a long-term downtrend, which remains incomplete. Since November, prices have been consolidating, forming a prolonged correction, which is still ongoing. Over the past three weeks, the pair has remained near the upper boundary of its established trading range.
Forecast:
During the first half of the week, sideways movement is likely, with a possible test of resistance. A trend reversal and decline toward support are expected after resistance is tested.
Potential Reversal Zones:
- Resistance: 0.8350 – 0.8400
- Support: 0.8180 – 0.8130
Recommendations:
- Selling: Enter after confirmed reversal signals near resistance.
- Buying: Low potential, could be unprofitable.
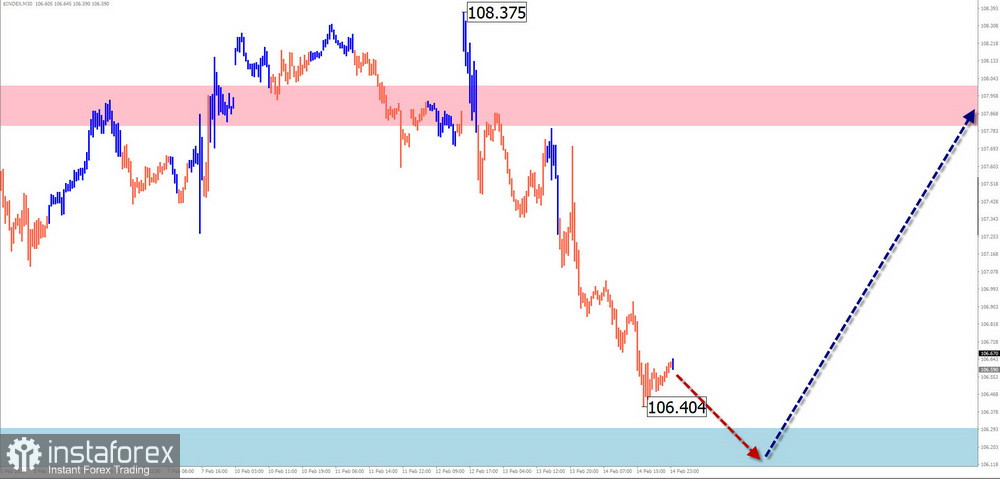
U.S. Dollar Index (DXY)
Analysis:
Since September, the U.S. Dollar Index has been in a bullish wave. However, since February 3, a bearish wave has emerged, reaching the upper boundary of a potential reversal zone. The latest correction phase is still incomplete.
Forecast:
In the coming days, the current decline should conclude. A reversal is expected near support, leading to a resumption of dollar strength by the end of the week or early next week.
Potential Reversal Zones:
- Resistance: 107.80 – 108.00
- Support: 106.30 – 106.10
Recommendations:
- The weakening of the U.S. dollar is currently the dominant trend.
- After a retracement this week, traders should look for buy signals in major currency pairs.
Explanation of Simplified Wave Analysis (SWA)
- All waves consist of three parts (A-B-C).
- Only the latest incomplete wave is analyzed on each timeframe.
- Dotted lines indicate expected price movements.
- Time duration is not factored into wave projections.