Monday, Tuesday and Wednesday can rightfully be called rainy days for global financial markets. In particular, traders and investors who had never encountered anything like it before, as a result, many of them received the so-called margin warning - margin call.
The positions of traders are large, the pledges are small, and the market itself is more likely to range than trend. The victims in such cases are those who do not comply with the risks and open positions in large volumes, but even those who observe the rules of money management and diversify their risks often find themselves in an unpleasant situation, which is caused by increased volatility. Today we'll talk about the application of volatility to analyze financial markets.
Volatility is the rate at which a price changes over a given period of time. A sharp increase in price fluctuations usually accompanies a fall in stock markets, from which important conclusions can be drawn. By analyzing the behavior of volatility, predicting the direction of its movement, it is possible to determine favorable and unfavorable periods for investments and opening positions in assets such as CFDs on stock indices - #SPX, gold - Gold and other precious metals, Japanese yen - USDJPY, US dollar and oil - #CL.
It is easier said than done, however, from the intermarket technical analysis, we know that when stock markets go down, there are changes in the price of safe havens and a decrease in the oil market. The relationship between the stock market and other assets looks like this: a decline in the stock market is accompanied by increased volatility, an increase in the dollar and gold prices, a decrease in the price of oil and the USDJPY pair.
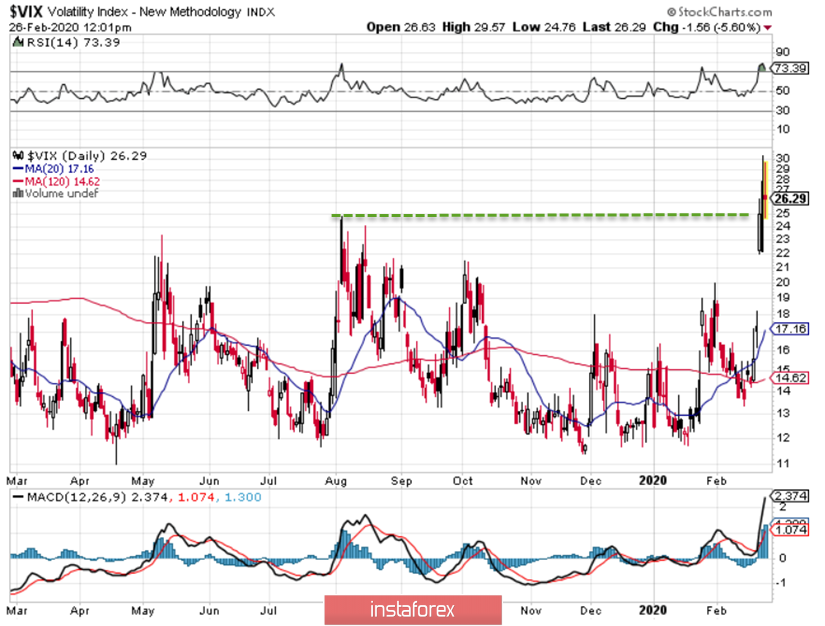
Quotes of all the above assets are available at InstaFOREX terminals, but where can I get data for volatility analysis? The answer to this question only at first glance seems complicated, the so-called "Fear Index" - VIX, which reflects the volatility of stock prices of the hundred leading US corporations included in the S&P 500 stock index, will help us in analyzing the structure of volatility. Multiple resources on the network offer convenient tools for analyzing this index, and in order not to blur the mind over the monitor, we will analyze the current situation in VIX (Fig. 1).
I want to explain to the readers the following points. The daily time reflects the situation from one month to six months. Period 5 on the daily time is a week, period 20 is a month, period 120 is six months. The standard settings for the RSI indicator in the stock market is period 14, the MACD indicator is set to 12.26.9 by default. Periods 20 and 120, which are closely related to business cycles, are especially important for analysis.
Fig. 1: VIX index, day, period one year.
So what does the current situation in the VIX index tell us? First of all, we see that the index indicators are 26.26 and exceeded the volatility indicators for the entire previous year. Therefore, we can say that as scary as it is now, the markets have not had since the active phase of the trade war between China and the United States in December 2018.
An interesting feature is that the stock market grows when the VIX index is below the 120-moving average, and other indicators are reduced. Now we see that indicators are growing. Consequently, conclusions from this situation will suggest a lack of opportunities to buy shares in US companies and the availability of opportunities for their sale. Similarly, one can evaluate stock indices - as long as the situation with volatility has not returned to normal, any recovery of stock indices should be considered from the point of view of opening trading positions.
However, this is not all, as follows from inter-market analysis, with increasing volatility, we should look for opportunities to buy precious metals, primarily gold, we can also consider buying the US dollar against a basket of foreign currencies, selling the USDJPY pair and selling oil. In other words, we do not consider signals that contradict our assumptions, and, on the contrary, look for signals that confirm our hypothesis, while not forgetting about the prospects for the movement of assets from one to six months. An analysis of volatility in other periods may give us solutions for short-term deals in lesser times.
Volatility analysis is a non-trivial task in itself, over which many traders and investors are puzzled. However, a trader who has the basics of technical analysis can always use this tool, which, however, does not eliminate the need for him to follow the rules of money management. Be cautious and careful.