empty
05.02.2024 05:32 AM
Trading Signals for BITCOIN (BTC/USD) on February 5-7, 2024: buy above $ 42,187 (3/8 Murray - 200 EMA)

This image is no longer relevant

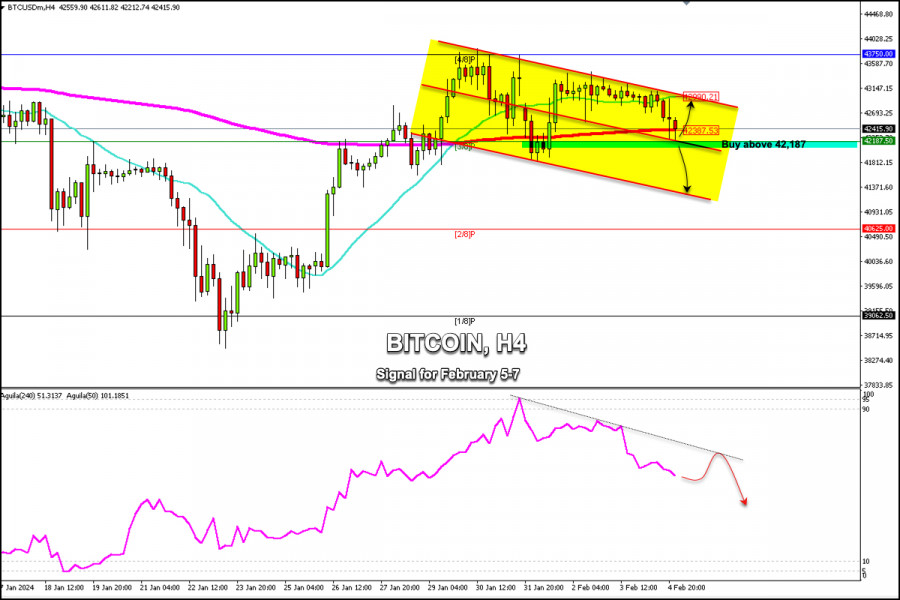
Early in the European session, Bitcoin (BTC/USD) is trading around the 200 EMA and above 3/8 Murray. We can see in the chart above that BTC is trading within the downtrend channel forming since January 27.

Practically, in the last few sessions, Bitcoin has been consolidating below the top of the bearish channel, with low volume and a decrease in volatility. Now we observe a technical rebound after having reached 42,000.

If Bitcoin falls below 3/8 Murray (42,187) or consolidates below $42,000 in the next few hours, we could expect a continuation of the bearish movement and the token could reach the low of January 28 around 41,600.

If the downward pressure prevails, the BTC price could approach the bottom of the downtrend channel at 41,150 and could ultimately reach the psychological level of $40,000 or around 2/8 Murray.

In case Bitcoin recovers, we should expect a sharp break above the 21 SMA at 42,990 and a break of the downtrend channel forming since January 27. Then, we could expect BTC to reach 43,750, a level that has become a strong barrier whose break could lead to the advance of Bitcoin in the short term and a rebound to $45,000.

As Bitcoin trades below 43,750, the outlook will remain negative for the instrument and any technical bounce could be seen as an opportunity to sell.

Below the 200 EMA (42,400) on the H4 chart, the outlook could be even more bearish and we could expect it to reach the low of January 23 around $38,500. The price could accelerate its fall. If BTC breaks this level, it could approach $35,000.

Technically, the eagle indicator has been giving a negative signal since January 30. So, if Bitcoin continues trading below $43,750, it is likely either to have a strong technical correction or a trade in the range between $43,750 and $40,625.

Summary
Urgency
Analytic
Dimitrios Zappas
Start trade
รับผลกำไรจากการเปลี่ยนแปลงอัตราสกุลเงินดิจิทัลกับ InstaForex.
ดาวน์โหลด MetaTrader 4 และเปิดการซื้อขายครั้งแรกของคุณ.
  • Grand Choice
    Contest by
    InstaForex
    InstaForex always strives to help you
    fulfill your biggest dreams.
    เข้าร่วมการแข่งขัน


บทความแนะนำ

USD/CAD: การวิเคราะห์และการพยากรณ์

เมื่อต้นเซสชันยุโรปในวันนี้ คู่เงิน USD/CAD พยายามหยุดการลดลงแต่ไม่ประสบความสำเร็จ ปัจจุบันกำลังเทรดอยู่ที่ประมาณ 1.3678 ความเชื่อมั่นในขาลงยังคงมีอยู่ เนื่องจากออสซิลเลเตอร์ในกราฟรายวันค่อยๆ เคลื่อนไปในพื้นที่ติดลบ ดัชนีความแข็งแกร่งสัมพัทธ์ (RSI) ระยะเวลา 14 วันอยู่ต่ำกว่า

Irina Yanina 19:49 2025-07-22 UTC+2

EUR/USD – วันที่ 22 กรกฎาคม: อัตราภาษี 30% สำหรับสหภาพยุโรป

ในวันจันทร์ คู่เงิน EUR/USD กลับมาเคลื่อนไหวในทิศทางขาขึ้นอีกครั้งหลังจากขึ้นไปอยู่เหนือระดับ 1.1645 อย่างดี ซึ่งตามที่ได้เตือนเอาไว้ก่อนหน้านี้ การดีดตัวจากระดับ Fibonacci ที่ 127.2% ที่ 1.1712 เป็นประโยชน์ต่อเงินดอลลาร์สหรัฐฯ ดังนั้นอาจเกิดการปรับฐานเล็กน้อย

Samir Klishi 11:42 2025-07-22 UTC+2

การพยากรณ์อัตราแลกเปลี่ยน 22/07/2025: EUR/USD, USD/JPY, Gold, SP500 และ Ethereum

ลิงก์ที่เป็นประโยชน์: บทความอื่น ๆ ของฉันสามารถดูได้ในส่วนนี้ หลักสูตรสำหรับผู้เริ่มต้นของ InstaForex การวิเคราะห์ยอดนิยม เปิดบัญชีซื้อขาย สำคัญ: ผู้เริ่มต้นในตลาดฟอเร็กซ์จำเป็นต้องระมัดระวังมากเมื่อทำการตัดสินใจในการเข้าสู่ตลาด ก่อนการประกาศรายงานสำคัญ ควรหลีกเลี่ยงที่จะเข้าเทรดในตลาดเพื่อป้องกันไม่ให้เผชิญกับความผันผวนที่เพิ่มขึ้นซึ่งอาจทำให้ราคาถูกโยนอารมณ์ได้ถ้าหากตัดสินใจทำการซื้อขายในช่วงที่มีการประกาศข่าว ควรตั้ง stop orders

Sebastian Seliga 11:26 2025-07-22 UTC+2

GBP/USD – 22 กรกฎาคม: เงินปอนด์ทะลุแนวโน้มขาลง

ในกราฟรายชั่วโมง คู่สกุลเงิน GBP/USD มีการกลับตัวใหม่ในทางที่เป็นประโยชน์ต่อเงินปอนด์เมื่อวันจันทร์ และสามารถยืนเหนือระดับฟีโบนักชี 76.4% ที่ 1.3470 ส่งผลให้เกิดการทะลุสองยอดก่อนหน้านี้ การยืนอยู่เหนือ 1.3470 นี้เป็นการเปิดทางให้เกิดการเติบโตต่อไปสู่ระดับฟีโบนักชีถัดไปที่ 61.8% - 1.3530

Samir Klishi 10:38 2025-07-22 UTC+2

EUR/USD: การวิเคราะห์อินดิเคเตอร์ในวันที่ 22 กรกฎาคม 2025

เมื่อวันจันทร์ คู่สกุลเงินเคลื่อนตัวลงและเกือบถึงฟรากตัลด้านบนที่ 1.1721 (แท่งเทียนรายวันจากวันที่ 16 กรกฎาคม 2025) หลังจากนั้นราคาถอยลงเล็กน้อย ปิดแท่งเทียนรายวันที่ 1.1692 วันนี้ ราคามีแนวโน้มที่จะเคลื่อนตัวขึ้น ข้อมูลปฏิทินที่มีผลแรงคาดว่าจะประกาศในวันอังคาร (เกี่ยวข้องกับ USD)

Stefan Doll 10:12 2025-07-22 UTC+2

EUR/USD: การวิเคราะห์ดัชนี ณ วันที่ 22 กรกฎาคม 2025

เมื่อวันจันทร์ที่ผ่านมา คู่สกุลเงินได้เคลื่อนตัวลงและเกือบแตะส่วนบนของรูปแบบฟรัคทัลที่ 1.1721 (ตามกราฟแท่งเทียนประจำวันที่ 16 กรกฎาคม 2025) จากนั้นราคาถอยกลับเล็กน้อยโดยปิดที่ระดับ 1.1692 ของกราฟแท่งเทียนประจำวัน ในวันนี้ ราคาอาจเคลื่อนตัวขึ้นอีกครั้ง มีข่าวสำคัญในปฏิทินคาดว่าจะมาในวันอังคาร (เกี่ยวข้องกับ USD)

Stefan Doll 09:45 2025-07-22 UTC+2

สัญญาณการซื้อขายสำหรับ EUR/USD ระหว่างวันที่ 22-25 กรกฎาคม 2025: ขายต่ำกว่า 1.1718 (200 EMA - 8/8 Murray)

ช่วงต้นของการซื้อขายในยุโรป ค่าเงินยูโรอยู่ที่ประมาณ 1.1689 มีการฟื้นตัวเล็กน้อยหลังจากที่แตะถึงจุดต่ำสุดของช่องแนวโน้มขาลงที่ประมาณ 1.1540 ค่าเงินยูโรอาจพบความยากลำบากในการเพิ่มสูงขึ้นต่อไป เนื่องจากระดับ 8/8 Murray อยู่ที่ประมาณ 1.1718 ซึ่งเป็นจุดบนสุดของช่องแนวโน้มขาลง ซึ่งเป็นอุปสรรคสำคัญต่อค่าเงินยูโร หากแรงซื้อยังคงสูงขึ้นและค่าเงินยูโรสามารถยืนอยู่เหนือ 1.1720

Dimitrios Zappas 06:41 2025-07-22 UTC+2

สัญญาณการซื้อขายสำหรับ GOLD (XAU/USD) สำหรับวันที่ 22-25 กรกฎาคม 2025: ซื้อเมื่อราคาสูงกว่า $3,380 และขายเมื่อราคาต่ำกว่า $3,370 (200 EMA - 7/8 Murray)

หลังจากที่สามารถทะลุแนวต้านที่แข็งแกร่งของระดับ 6/8 Murray ไปแล้ว ทองคำได้มีการเคลื่อนไหวขึ้นแบบแข็งแกร่ง โดยไปถึงระดับ 7/8 Murray ซึ่งอยู่ราว ๆ ระดับ $3,400 อย่างไรก็ตาม พื้นที่นี้เป็นอุปสรรคที่แข็งแกร่งมาแต่เดิม เพราะเคยกดดันราคาทองคำอย่างมากมาก่อนหน้านี้

Dimitrios Zappas 06:39 2025-07-22 UTC+2

สัญญาณการซื้อขายสำหรับ BITCOIN วันที่ 22-25 กรกฎาคม 2025: ซื้อเมื่อราคาสูงกว่า $115,625 (/8 Murray - 21 SMA)

Bitcoin มีการซื้อขายอยู่ที่ประมาณ 117,522 ดอลลาร์ ขยับกลับขึ้นมาหลังจากที่เคยลดลงต่ำถึง 116,070 ดอลลาร์ เมื่อวานนี้ในช่วงตลาดยุโรป Bitcoin ขึ้นไปสูงถึง 119,500 ดอลลาร์ แต่ไม่สามารถยืนยันราคาเหนือระดับจิตวิทยาที่ 120,000 ดอลลาร์ได้

Dimitrios Zappas 06:37 2025-07-22 UTC+2

การคาดการณ์ EUR/USD สำหรับวันที่ 22 กรกฎาคม 2025

เมื่อวันจันทร์ ยูโรทะลุระดับแนวต้านเป้าหมายที่ 1.1692 ด้วยเงาด้านบนของแท่งเทียนสีขาวรายวัน หากยูโรเลือกช่วง 1.1535–1.1692 เป็นโซนการรวมตัวก่อนการประชุมของ Federal Reserve ในเดือนกรกฎาคม คาดว่าจะมีการดึงกลับ แม้ว่าราคาจะพยายามขยายช่วงนี้และสร้างความสับสนบ้าง แต่น่าจะถูกจำกัดโดยเส้น MACD ใกล้ระดับ

Laurie Bailey 06:35 2025-07-22 UTC+2
หากไม่สะดวกคุยในตอนนี้
ระบุคำถามไว้ได้ใน แชท.
Widget callback
 

Dear visitor,

Your IP address shows that you are currently located in the USA. If you are a resident of the United States, you are prohibited from using the services of InstaFintech Group including online trading, online transfers, deposit/withdrawal of funds, etc.

If you think you are seeing this message by mistake and your location is not the US, kindly proceed to the website. Otherwise, you must leave the website in order to comply with government restrictions.

Why does your IP address show your location as the USA?

  • - you are using a VPN provided by a hosting company based in the United States;
  • - your IP does not have proper WHOIS records;
  • - an error occurred in the WHOIS geolocation database.

Please confirm whether you are a US resident or not by clicking the relevant button below. If you choose the wrong option, being a US resident, you will not be able to open an account with InstaForex anyway.

We are sorry for any inconvenience caused by this message.