empty
09.04.2025 02:55 AM
Trading Recommendations and Analysis for EUR/USD on April 9: The Market Is Getting Ready to Break Out Again

EUR/USD 5-Minute Analysis

This image is no longer relevant

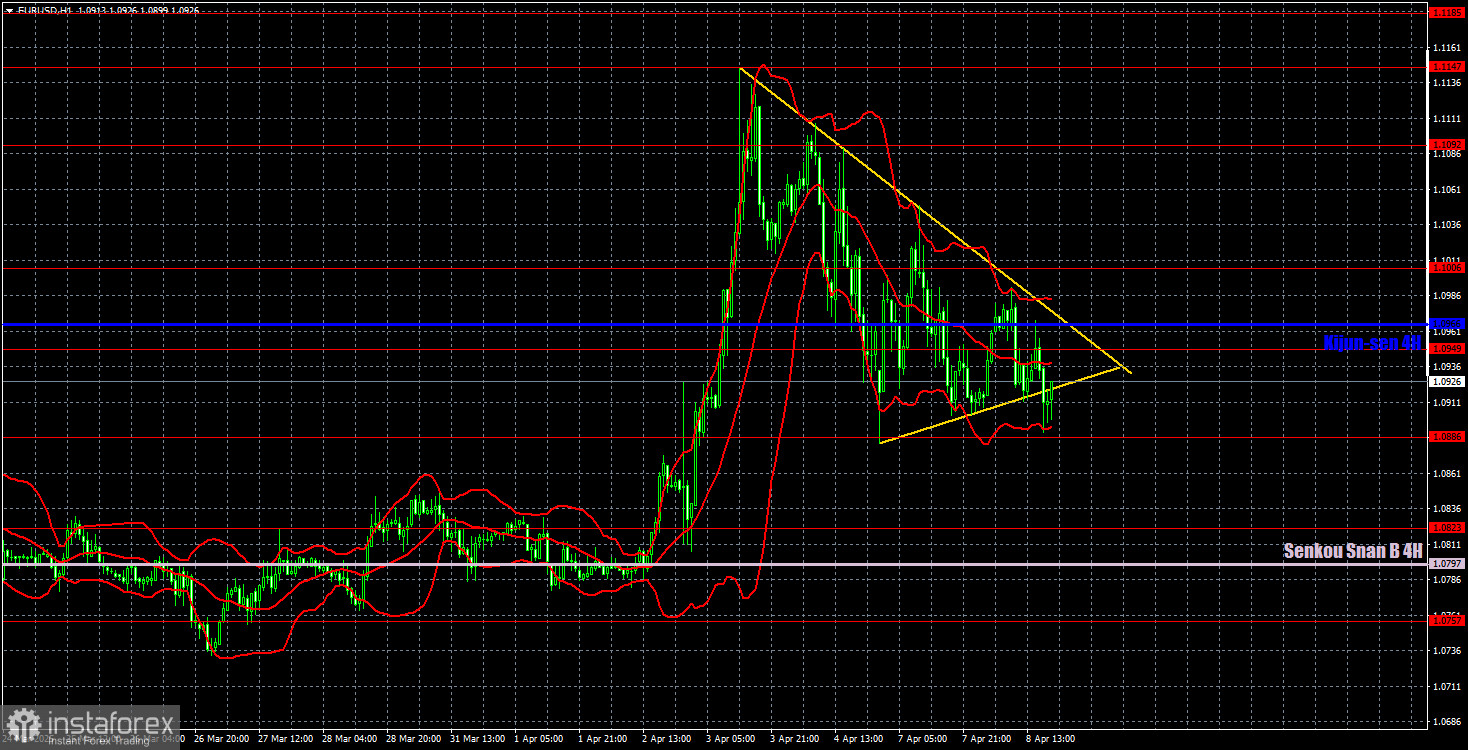
The EUR/USD currency pair calmed down slightly on Tuesday, but the technical picture does not promise anything good—nor does the fundamental background. Let's start with the technicals. A classic "bullish flag" formed in the hourly timeframe, a precursor to a new upward movement. This pattern can also be called a triangle or a narrowing triangle. The essence remains the same. Let us recall that a breakout above the upper boundary would indicate a continuation of the uptrend. However, it is not uncommon for the price to first make a false breakout below before rallying sharply. Therefore, in the near term—stay alert and on standby.

As for the fundamentals, Trump is preparing a response to China's retaliatory tariffs, and it appears this saga will drag on for a long time. Recall that any new tariffs imposed by the U.S. have consistently triggered a decline in the dollar. Thus, another collapse of the U.S. currency may be expected soon, even though this doesn't align with higher timeframes. Moreover, the European Union is also preparing retaliatory tariffs, and Trump threatens to impose additional duties on the EU. There were no macroeconomic events on Tuesday, so there is nothing to analyze.

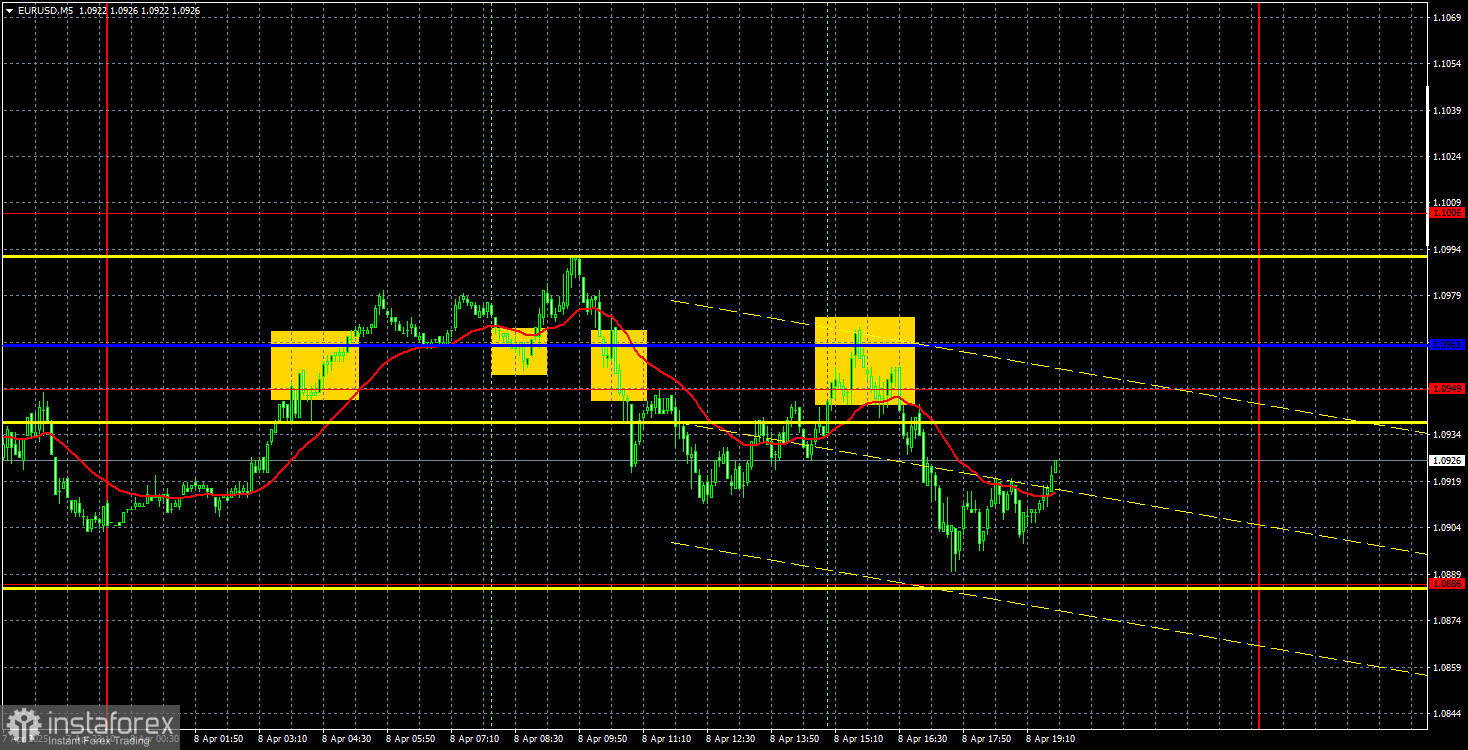
In the 5-minute timeframe, several trading signals were generated—all in the area of 1.0949–1.0963. First, two duplicate buy signals appeared, followed by two consecutive sell signals. The first two signals allowed for opening one long position, but it was closed at breakeven by a Stop Loss. The latter two signals allowed for opening two short positions, and only by the evening did the price reach (with a slight margin of error) the nearest target level at 1.0886. Therefore, that trade was the only profitable one.

COT Report

This image is no longer relevant

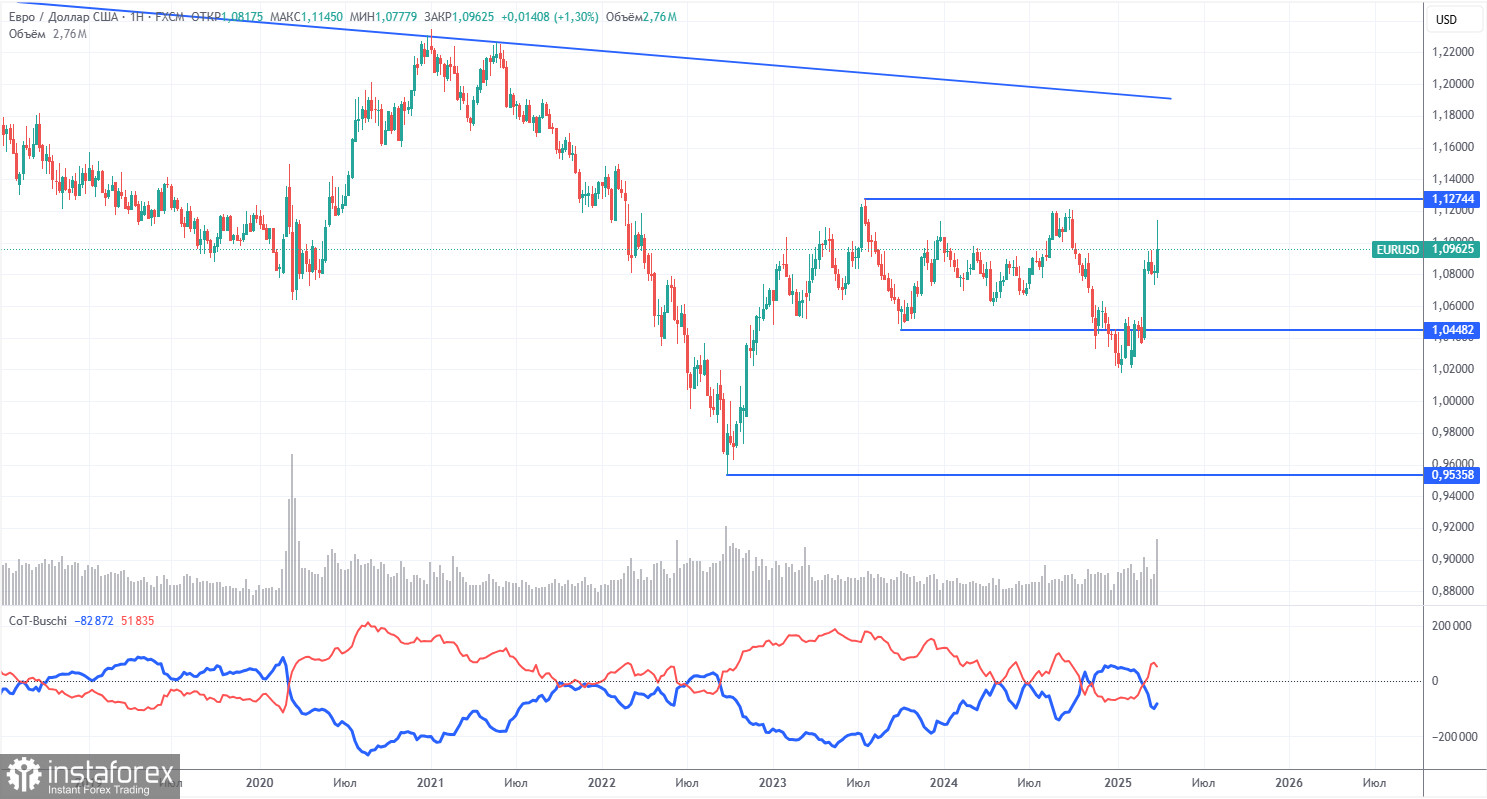
The latest COT report is dated April 1. As shown in the chart, the net position of non-commercial traders remained bullish for a long time. The bears barely managed to gain control briefly, but now the bulls are back in charge. The bears' advantage has faded fast since Trump took office, and the dollar has since plunged. We cannot say definitively that the dollar's decline will continue, and the COT reports reflect sentiment among major players, which can shift quickly in today's environment.

We still see no fundamental factors supporting euro strength—but one decisive factor for dollar weakness has emerged. The correction may last for weeks or even months, but a 16-year downward trend isn't going to end so quickly.

The red and blue lines have crossed again, indicating a bullish market trend. During the latest reporting week, the number of long positions in the "non-commercial" group fell by 6,500, while short positions increased by 7,100. As a result, the net position declined by 13,600 contracts.

EUR/USD 1-Hour Analysis

This image is no longer relevant

On the hourly timeframe, the EUR/USD pair resumed its upward movement as soon as Trump introduced new tariffs. We believe a decline will resume in the medium term due to the divergence in monetary policy between the ECB and the Fed. However, it's unclear how long the market will continue to react solely to the "Trump factor"—or where the pair will end up afterward. Currently, the markets are dominated by panic and chaos, so if we previously refrained from forecasting further price movements, now we're even more cautious. Our only recommendation is to wait until the "crisis" subsides or at least begins to ease.

For April 9, we highlight the following levels for trading: 1.0461, 1.0524, 1.0585, 1.0658–1.0669, 1.0757, 1.0797, 1.0823, 1.0886, 1.0949, 1.1006, 1.1092, 1.1147, 1.1185, 1.1234, as well as the Senkou Span B line (1.0797) and the Kijun-sen line (1.0966). Ichimoku indicator lines may shift throughout the day, which should be considered when identifying trading signals. Don't forget to move your Stop Loss to breakeven once the price has moved 15 pips in the right direction. This helps protect against potential losses if the signal turns out to be false.

On Wednesday, the only somewhat notable event is the release of the Fed's minutes, but it's unlikely that any market participants will pay much attention to it. Thus, if new tariff news emerges today, further volatility may follow. If not, the market will likely continue trading more subduedly.

Illustration Explanations:

  • Support and Resistance Levels (thick red lines): Thick red lines indicate where movement may come to an end. Please note that these lines are not sources of trading signals.
  • Kijun-sen and Senkou Span B Lines: Ichimoku indicator lines transferred from the 4-hour timeframe to the hourly timeframe. These are strong lines.
  • Extreme Levels (thin red lines): Thin red lines where the price has previously bounced. These serve as sources of trading signals.
  • Yellow Lines: Trendlines, trend channels, or any other technical patterns.
  • Indicator 1 on COT Charts: Represents the net position size for each category of traders.
Summary
Urgency
Analytic
Stanislav Polyanskiy
Start trade
Gana con los cambios en el valor de las criptomonedas con InstaForex.
Descarga MetaTrader 4 y abre tu primera operación.
  • Grand Choice
    Contest by
    InstaForex
    InstaForex always strives to help you
    fulfill your biggest dreams.
    UNIRSE AL CONCURSO

Recommended Stories

GBP/USD: plan para la sesión americana del 31 de julio (análisis de las operaciones matutinas).La libra sufre otra oleada de ventas

Ayer se formaron varios puntos de entrada al mercado. Veamos el gráfico de 5 minutos y analicemos lo que ocurrió. En mi pronóstico de la mañana presté atención al nivel

Miroslaw Bawulski 07:34 2025-07-31 UTC+2

EUR/USD: plan para la sesión americana del 31 de julio (análisis de las operaciones matutinas). El dólar subió tras la decisión de la Fed

Ayer se formó solo un punto de entrada al mercado. Veamos el gráfico de 5 minutos y analicemos lo que ocurrió. En mi pronóstico de la mañana presté atención

Miroslaw Bawulski 07:34 2025-07-31 UTC+2

Recomendaciones para operar y análisis de las operaciones con el par EUR/USD para el 31 de julio. De mal en peor.

El par de divisas EUR/USD continuó con su movimiento descendente durante el miércoles. Ayer, la caída de las cotizaciones del euro y el crecimiento del dólar fue provocado, en esencia

Paolo Greco 04:00 2025-07-31 UTC+2

GBP/USD: plan para la sesión americana del 30 de julio (análisis de las operaciones matutinas). La libra intenta subirr

En mi pronóstico de la mañana presté atención al nivel de 1.3365 y planeaba tomar decisiones de entrada al mercado desde allí. Veamos el gráfico de 5 minutos y analicemos

Miroslaw Bawulski 13:20 2025-07-30 UTC+2

EUR/USD: plan para la sesión americana del 30 de julio (análisis de las operaciones de la mañana). El euro reaccionó débilmente al PIB de la eurozona

En mi pronóstico de la mañana presté atención al nivel de 1.1571 y planeé tomar decisiones de entrada al mercado desde allí. Veamos el gráfico de 5 minutos y analicemos

Miroslaw Bawulski 13:20 2025-07-30 UTC+2

Recomendaciones para operar y análisis de las operaciones con el par GBP/USD el 24 de julio. La libra no encontró razones para hacer una pausa.

Análisis del par GBP/USD 5M. El par de divisas GBP/USD durante el miércoles, a diferencia del par EUR/USD, continuó tranquilamente su movimiento hacia el Norte. Durante el día no hubo

Paolo Greco 07:22 2025-07-24 UTC+2

Recomendaciones para operar y análisis de las operaciones con el par EUR/USD el 24 de julio. Los acuerdos comerciales de Trump no ayudaron al dólar.

Análisis del par EUR/USD 5M. El par de divisas EUR/USD durante el miércoles no mostró ningún movimiento interesante, y el mercado no mostró ningún interés en los acuerdos comerciales

Paolo Greco 07:21 2025-07-24 UTC+2

GBP/USD: plan para la sesión europea del 23 de julio. Informes COT (análisis de las operaciones de ayer). La libra actualizó el máximo semanal

Ayer se formaron varios puntos de entrada al mercado. Vamos a ver el gráfico de 5 minutos y entender qué ocurrió. En mi pronóstico de la mañana presté atención

Miroslaw Bawulski 08:47 2025-07-23 UTC+2

EUR/USD: plan para la sesión europea del 23 de julio. Informes COT (análisis de las operaciones de ayer). El euro creció bastante bien

Ayer se formaron varios puntos de entrada al mercado. Vamos a ver el gráfico de 5 minutos y entender qué pasó allí. En mi pronóstico de la mañana presté atención

Miroslaw Bawulski 08:47 2025-07-23 UTC+2

Recomendaciones para operar y análisis de las operaciones con el par GBP/USD el 23 de julio. El crecimiento lógico continúa.

El par de divisas GBP/USD también continúa su movimiento ascendente durante el martes. La nueva caída de la moneda estadounidense puede intentarse vincular con el discurso de Jerome Powell, como

Paolo Greco 07:54 2025-07-23 UTC+2
¿No puede hablar ahora mismo?
Ingrese su pregunta en el chat.
Widget callback
 

Dear visitor,

Your IP address shows that you are currently located in the USA. If you are a resident of the United States, you are prohibited from using the services of InstaFintech Group including online trading, online transfers, deposit/withdrawal of funds, etc.

If you think you are seeing this message by mistake and your location is not the US, kindly proceed to the website. Otherwise, you must leave the website in order to comply with government restrictions.

Why does your IP address show your location as the USA?

  • - you are using a VPN provided by a hosting company based in the United States;
  • - your IP does not have proper WHOIS records;
  • - an error occurred in the WHOIS geolocation database.

Please confirm whether you are a US resident or not by clicking the relevant button below. If you choose the wrong option, being a US resident, you will not be able to open an account with InstaForex anyway.

We are sorry for any inconvenience caused by this message.